Fitting a Polynomial to Data
- Interpolation involves constructing and then evaluating an interpolating function.
- interpolant,
 , determined by requiring that it pass through the known data
  .
.
- In its most general form, interpolation involves determining the coefficients
- in the linear combination of n basis functions,
 , that constitute the interpolant
- such that
 for
for
 . The basis function may be polynomial
- or trigonometric
- or some other suitable set of functions.
- Polynomials are often used for interpolation because they are easy to evaluate and easy to manipulate analytically.
- Suppose that we have
Table 5.1:
Fitting a polynomial to data.
| x |
f(x) |
| 3.2 |
22.0 |
| 2.7 |
17.8 |
| 1.0 |
14.2 |
| 4.8 |
38.3 |
| 5.6 |
51.7 |
- First, we need to select the points that determine our polynomial.
- The maximum degree of the polynomial is always one less than the number of points.
- Suppose we choose the first four points. If the cubic is
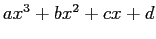 ,
,
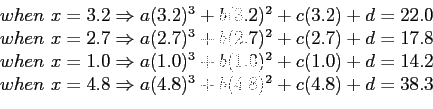
- We can write four equations involving the unknown coefficients
 , and
, and  ;
;
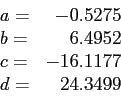
- Solving these equations gives
- and our polynomial is
- At
 , the estimated value is 20.212.
- if we want a new polynomial that is also made to fit at the point
 ?
?
- or if we want to see what difference it would make to use a quadratic instead of a cubic?
- Study this example in MATLAB;
 .
.
![$ » x=[ 3.2 2.7 1.0 4.8 5.6];$](img666.png)
![$ » y=[22 17.8 14.2 38.3 51.7];$](img667.png)
- Another example;
Table 5.2:
Interpolation of gasoline prices.
| year |
price |
| 1986 |
133.5 |
| 1988 |
132.2 |
| 1990 |
138.7 |
| 1992 |
141.5 |
| 1994 |
137.6 |
| 1996 |
144.2 |
- Use the polynomial order 5, why?
- Make a guess about the prices of gasoline at year of 2011.
- Now, try with the shifted dates.
- Make the necessary corrections for the following lines
- What differs in the plot and why?
- Study this example in MATLAB;
.
Cem Ozdogan
2011-12-27
![\includegraphics[scale=1.5]{figures/3-2}](img669.png)