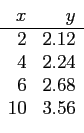
- For the given data points;
- Study this example in MATLAB;
 .
.
- Fit to linear polynomial, quadratic polynomial, cubic polynomial.
- For each polynomial;
- interpolate for

- extrapolate for

- Compare your results, which one is the best? Why?
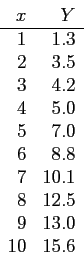
- For the given data points;
- i
- Plot it (such as plot(x,Y,'o')).
- ii
- The graph suggest a linear relationship.
values for the parameters,  and
and  , can be obtained from the plot.
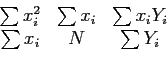
- iii
- Write a MATLAB code that calculates each summation;
All the summations are from  to
to  .
.
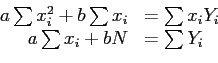
- iv
- Then it is obtained as
Solving these equations simultaneously gives the values for slope and intercept and . Now, we have a function in the form;
- v
- Plot them (such as plot(x,y,x,Y,'o')).
Cem Ozdogan
2011-12-27