Spline Curves
Figure 5.2:
Fitting with different degrees of the polynomial.
|
|
- There are times when fitting an interpolating polynomial to data points is very difficult.
- Figure 5.2a is plot of
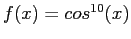 on the interval
 ![$ [-2, 2]$](img781.png) .
.
- It is a nice, smooth curve but has a pronounced maximum at
 and is near to the
  -axis for
  .
.
- The curves of Figure 5.2b,c, d, and e are for polynomials of degrees
 and
and  that match the function at evenly spaced points.
- None of the polynomials is a good representation of the function.
Figure 5.3:
Fitting with quadratic in subinterval.
|
|
- One might think that a solution to the problem would be to break up the interval into subintervals
- and fit separate polynomials to the function in these smaller intervals.
- Figure 5.3 shows a much better fit if we use a quadratic between
 and
and  , with
  outside that interval.
- That is better but there are discontinuities in the slope where the separate polynomials join.
- This solution is known as spline curves.
Subsections
Cem Ozdogan
2011-12-27
![\includegraphics[scale=0.4]{figures/3-6}](img779.png)
![\includegraphics[scale=0.25]{figures/3-7}](img786.png)
![\includegraphics[scale=0.3]{figures/3-8}](img793.png)