- A discrete random variable assumes each of its values with a certain probability.
- Frequently, it is convenient to represent all the probabilities of a random variable
 by a formula;
- Definition 3.4:

- The probability distribution of a discrete random variable can be presented in the form of a mathematical formula, a table, or a graph- probability histogram or barchart.
Example: Let be the random variable: number of heads in 3 tosses of a fair coin.
| Sample Space |
 |
| TTT |
0 |
| TTH |
1 |
| THT |
1 |
| THH |
2 |
| HTT |
1 |
| HTH |
2 |
| HHT |
2 |
| HHH |
3 |
 : Probability that outcome is a specific value.
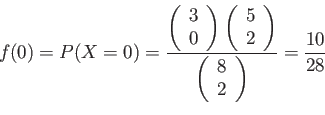
- Example 3.8: A shipment of 8 similar microcomputers to a retail outlet contains 3 that are defective.
- If a school make a random purchase of 2 of these computers.
- Find the probability distribution for the number of defectives.
- Definition 3.5:
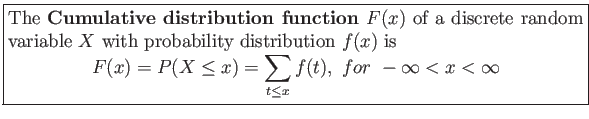
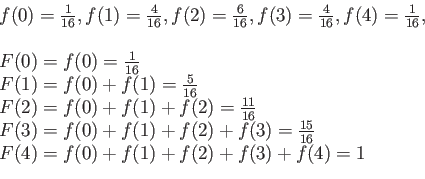
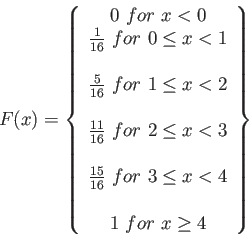
- Example 3.10: Find the cumulative distribution of the random variable in Example 3.9.
Figure 3.1:
Bar chart and probability histogram
|
|
Figure 3.2:
Discrete cumulative distribution.
| [
|
Cem Ozdogan
2012-02-15


![\includegraphics[scale=0.45,angle=1]{figures/03-01}](img295.png)
![\includegraphics[scale=0.45]{figures/03-02}](img296.png)
![\includegraphics[scale=0.45]{figures/03-03}](img297.png)