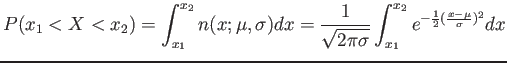
- The probability of the random variable
 assuming a value between
  and
and  .
.
- The area under the curve between any two ordinates must also depend on the values
 and
and  .
.
Figure 6.6:
 : area of the shaded region.
|
|
Figure 6.7:
for different normal curves.
|
|
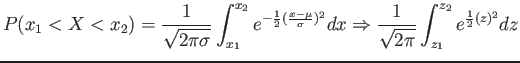
- Definition 6.1:
- Transformation:
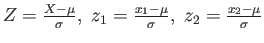
- Then;
 and
and

Figure 6.8:
The original and transformed normal distributions.
|
|
Example 6.2: Given a standard normal distribution, find the area under the curve that lies
- xxi
- to the right of

1 minus the area to the left of (see Table A.3)
- xxii
- between
 and
and 
The area to the left of minus the left of
Figure 6.9:
Areas for Example 6.2.
|
|
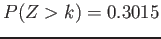
Example 6.3:
Given a standard normal distribution, find the value of k such that
- xxiii
-
- xxiv
-
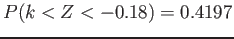
Figure 6.10:
Areas for Example 6.3.
|
|
- Example 6.4: Given a random variable having a normal distribution with
 and
and
 ,
,
- Find the probability that assumes a value between 45 and 62.
- Solution:
Figure 6.11:
Area for Example 6.4.
|
|
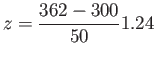
- Example 6.5 Given that a normal distribution with
 and
and
 , find the probability that assumes a value greater than 362.
- Solution:
Figure 6.12:
Area for Example 6.5.
|
|
- Using the Normal Curve in Reverse
- We might want to find the value of
 corresponding to a specified probability.
- The steps:
- Begin with a known area or probability.
- Find the values corresponding to the tabular probability that comes closest to the specified probability.
- Determine
 by rearranging the formula
Example 6.6: Given a normal distribution with  and
and  , find the value of that has
- xxv
- 45% of the area to the left
From Table A.3 we find
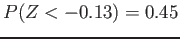 . Hence
- xxvi
- 14% of the are to the right
From Table A.3, we find
 . Hence
Figure 6.13:
Areas for Example 6.6.
|
|
Cem Ozdogan
2012-02-15


![\includegraphics[scale=1]{figures/06-06}](img694.png)
![\includegraphics[scale=1]{figures/06-07}](img695.png)
![\includegraphics[scale=1]{figures/06-08}](img702.png)
![\includegraphics[scale=0.6]{figures/06-09}](img708.png)
![\includegraphics[scale=1]{figures/06-10}](img709.png)
![\includegraphics[scale=1]{figures/06-11}](img717.png)
![\includegraphics[scale=0.45]{figures/06-12}](img723.png)
![\includegraphics[scale=0.35]{figures/06-13}](img729.png)
![\includegraphics[scale=0.75]{figures/06-14}](img737.png)