- The result of a statistical analysis is the estimation of parameters of a postulated model.
- A statistical model is not deterministic but, rather, must entail some probabilistic aspects.
- A model form is often the foundation of assumptions that are made by the analyst.
- Example 1.2 scientists draw some distinction between ``nitrogen'' and ``no-nitrogen'' populations through the sample information.
- The analysis may require a certain model for the data, e.g., normal (Gaussian) distributions.
- Some simple graphics (plots) can suggest the clear distinction between the samples, e.g., means and variability.
- Often, plots can illustrate information that sometimes are not retrieved from the formal analysis.
- Example of tensile strength. A textile manufacturer design an experiment to determine the relationship between the tensile strength and the cotton percentage of the cloth specimens.
- Five cloth specimens are tested for each of the four cotton percentages.
- A reasonable model is that each sample comes from a normal distribution.
Table 4:
Observation of nitrogen influences.
| Cotton |
Tensile |
| Percentage |
Strength |
| 15 |
7, 7, 9, 8, 10 |
| 20 |
19, 20, 21, 20, 22 |
| 25 |
21, 21, 17, 19, 20 |
| 30 |
8, 7, 8, 9, 10 |
Figure 7:
Plot of tensile strength and cotton percentages.
|
|
- It is likely that the scientist anticipates the existence of a maximum population mean of tensile strength.
- Here the analysis of the data may revolve around a different type of model, whose structure relating the population mean tensile strength to the cotton concentration.
- E.g., a regression model;
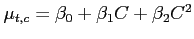 where
where  is the population mean tensile strength, which varies with the amount of cotton in the product
  .
.
- The use of an empirical model is accompanied by estimation theory, where
 are estimated by the data.
- The type of model used to describe the data often depends on the goal of the experiment.
- The structure of the model should take advantage of nonstatistical scientific input.
- A selection of a model represents a fundamental assumption upon which the resulting statistical inference is based.
- Often, plots (graphics)can illustrate information that allows the results of the formal statistical inference to be better communicated to the scientist or engineer, and teach the analyst something not retrieved from the formal analysis.
Cem Ozdogan
2010-02-13
![\includegraphics[scale=0.6]{figures/01-06}](img35.png)