Next: Fourier Series Up: Approximation of Functions Previous: Chebyshev Series Contents
function week9litem1(ll,ul,s)
format short;
%format long;
disp(' x e^x Chebyshev Error Maclaurin Error')
x =(ll:s:ul)';
taylor=exp(x);
max=(ul-ll)/s+1;
for i=1:max
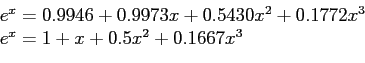
chebyshev=(0.9946 + 0.9973*x(i) + 0.5430*x(i)^2 + 0.1772*x(i)^3);
errorchebyshev(i)=taylor(i)-chebyshev;
maclaurin=(1+x(i)+0.5*x(i)^2+0.1667*x(i)^3);
errormaclaurin(i)=taylor(i)- maclaurin;
D=[x(i),taylor(i),chebyshev,errorchebyshev(i),maclaurin,
errormaclaurin(i)];
disp(D);
end
plot(x,errorchebyshev,'o',x,errormaclaurin,'-')
save with the name week9litem1.m. Then;
>> week9litem1(-1,1,0.1)
![\includegraphics[scale=0.43]{figures/week9litem1}](img958.png)
![\includegraphics[scale=1.3]{figures/4-7}](img960.png)